|
|
||||
The “hottest day” is not that hot, and very irrelevantSo the news cycle went hyperbolic over a single dubious hot day in records that only go back 0.01% of human existence. Remember when “30 year trends” were all that mattered? Let’s ignore for the moment that the error bars on measurements of global temperature in 1899 would make any normal scientist blush. Who believes for one minute even today we can measure the global surface temperature to one hundredth of a degree? The cringeworthy insignificant digits were everywhere. On Monday the Earths surface was supposedly 17.01 degrees Celsius for the first time in “human history”. Then Tuesday it was 17.18C, Hallelujah. Who are we kidding? Probably the biggest lie was to call this “human history” as if the ancient Egyptians were measuring the temperature on Earth and every day of the week. Are we really sure we know what the temperature was on July 3, 2201 BC? Maybe it was 17.31C that day — prove me wrong? We have no idea how hot the “hottest days” were for 99% of human civilization. The best proxies we have can’t tell us what the temperature was for 24 hour periods. We can’t compare 20 year smoothed averages with a single 24 hour snapshot. Well, scientific prostitutes can, but not real scientists. If it was a record “hottest day”, it might have been the hottest day in the last 40 years (maybe, and if only we had good thermometers, didn’t put them at airports, near air conditioners and incinerators, didn’t go electronic, hide the calibration data, and adjustify the records, eh?). It’s a big so-what. And in the end we know it there have been hotter years before in human civilization, and probably thousands of them. Who is trying to erase the Holocene?Don’t they teach climate scientists anything anymore? Karsten Haustein, from the University of Leipzig was telling the BBC that July will possibly be the hottest “since the Eemian”, 120,000 years ago, as if the Holocene optimum period didn’t exist. A mere 5,000 years ago sea levels were higher, corals were happy, people thrived, and Greenland was a lot warmer. This was a global phenomenon — higher sea levels and some 6,000 boreholes drilled around the world show the same pattern. It was hotter for thousands of years and CO2 was irrelevant. What the world needs are some real science journalists who can ask these badly trained junior modelers what happened to the Holocene?  This graph shows the ice-core data up until 1855. The last 150 years (1705 to 1855) are highlighted in red to show the warming as the Earth began coming out of the Little Ice Age. Sea levels were higher all around the worldHow could the oceans be higher all around the world if the world was not warmer? Sea levels have been falling for the last 7,000 years around Australia, they used to be nearly 1m higher in the South China Sea, South Africa and Polynesia and it’s a similar pattern around the world (thanks NoTricksZone). Studies on mangroves in Brazil show sea levels were about 2.7 meters higher in the mid-Holocene, and mangroves grew 34 kilometers further inland. (Fontes et al 2017). CO2 Science lists references all over the world. I am barely skimming the surface. Other researchers estimate the waters flowing out of the Pacific Ocean past Indonesia were a full 2 degrees Celcius warmer 7,000 years ago. (Rosenthal, (2013). Somehow corals did not go extinct, ancient viruses didn’t wipe out the Sumerians, and humans spread across the Earth. Sea levels were higher off the very geologically stable Western Australia 7,000 years ago. Across the other side of Australia in NSW sea levels were 1 – 1.5m higher. 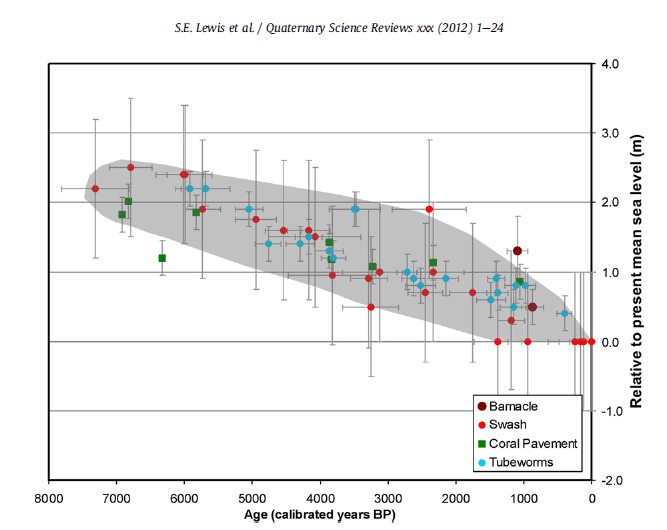 Sea level has been falling for 7,000 years in Western Australia (Lewis et al) A thousand stories of human pain and triumph from the last ten thousand years are being erased from the records. Australian Aboriginals apparently struggled through a 1,500 year mega drought about 6,000 years ago (see McGowan et al 2012). And massive fires raged across far north Australia 4,000 years ago that were far worse than today. (Rehn et al 2021). Another proxy suggesting the Holocene warmer temperatures were global is the heat flow data measured in 6,000 boreholes across six continents down to about 2km. Sometime from 5,000 to 10,000 years ago temperatures were hotter than they are now.  6,000 boreholes drilled around Earth show temperatures were hotter in the holocene. Figure 1. Suite of reconstructions of surface temperature history over the last 20,000 years. Nine curves correspond to three values of thermal diffusivity. The reference level is the mean of the instrumental record from 1961-1990 AD. (Huang et al 2008) The hottest day in the last 150 years is irrelevant. REFERENCESKeep reading → This week, newspapers in the UK appear to be full of Carmageddon headlines.Thanks to NetZeroWatch and Ballyb, for the compilation of EV warning signs on the road to West Debacle. The big advantage of an EV used to be the cheap fill but that’s all changed in the least year with the energy crisis. If the workers can’t afford to turn on the oven to cook a Sunday Roast, they can hardly afford to power up a car.
Meanwhile, the UK is speeding towards the 2030 EV mandate five years faster than the rest of the world, and the backlash is growing. A Daily Mail poll finds only 1 in 4 people think it’s a good idea to ban sales of petrol and diesel cars by 2030. Fully 53% of people don’t like it. Is the UK a democracy or not? Manufacturing and industry leaders are using words like “ruinous” and talking of “the end of UK car production.” They’re warning that 800,000 UK jobs are at risk. Nothing about this makes sense. EV’s are a lousy way to change the weather. No one even knows if EV’s will reduce carbon dioxide. At the moment in the UK 36 cars are fighting over every public charging site. Electricity demand is expected to double in the UK due to EV’s yet there is no plan to provide the extra capacity. Perhaps the real plan is to get half the country onto electric buses…? The electric car ‘revolution’ is a disaster before it’s begunPoliticians are forcing electric cars on a public that doesn’t want them Ben Marlow, The Telegraph The electric car revolution is stalling, of that there can no longer be any doubt. It has left the big global carmakers floundering… But it’s the setback at VW that stands out, raising serious questions about whether politicians are making the catastrophic mistake of forcing electric cars on a public that doesn’t want them. Think about it for a second: an entire industry not only forced to abandon a product that the vast majority of people still want and use, but also bullied into channelling all its resources into making something on a colossal level that there simply isn’t the market for – at least not within the horrendously short timeframe that is being imposed on car manufacturers. It’s industrial self-sabotage and a commercial, economic and social catastrophe in the making. Mandating EVs is an “assault on the working class” says Joel Kotkin.EV owners are wealthier, the cars are more expensive, and mandates will put owning a car out of reach of the unwashed masses… This rush to electric cars is a colossal mistakeSpiked Online Replacing the massive $3 trillion global car industry is an extremely high-risk economic gamble, particularly for the West. In simple terms, the push for EVs represents an assault on the working class. Two-thirds of all EV owners have incomes in excess of $100,000. EV mandates are also likely to force up the price of now restricted traditional cars. In the meantime, greens will demand higher fuel prices to reduce drivers’ consumption of the demon petrol. Ultimately, as even the Washington Post recently admitted, electric vehicles are hastening a return to conditions not seen since the early 20th century, when the automobile was a luxury item. ‘New cars, once part of the American Dream, [are] now out of reach for many’, it notes. Just to repeat… None of this makes sense. Even if people have a religious fixation on climate change, this isn’t the path to salvation: Economist Bjorn Lomborg calculates that a wholesale shift to EVs will lead to a reduction of global temperatures of no more than 0.0002 degrees Fahrenheit by 2100. Kotkin asks “who benefits”:
…the biggest winner is China. Today, China produces twice as many EVs as the US and the EU combined. Its leading EV maker, BYD, is now the world’s largest. Its electric-car exports are expected to almost double this year, helping it to overtake Japan as the biggest car exporter worldwide, according to the South China Morning Post. China has control of much of the worlds rare metals. Giving up an industry with a century of expertise and mass public support for a new high risk industry that depends on foreign supply lines needs some explanation. No one believes we’re doing it to fix the weather. ——————- Joel Kotkin is a spiked columnist, the presidential fellow in urban futures at Chapman University and executive director of the Urban Reform Institute. His latest book, The Coming of Neo-Feudalism, is out now. Follow him on Twitter: @joelkotkin Image by OpenIcons from Pixabay | Das Logo der Marke Volkswagen Nutzfahrzeuge | VW EV Photo by Vogler, There was a young climate-change tzar, –Ruairi
UN Human Rights commissioner turns into a hellfire prophetVolker Turk has looked into his crystal bowl and sees five or ten plagues coming — there will be famine, flood, and fire, and the Earth is melting — it may cease to exist or perhaps even evaporate? Luckily, the UN knows how to save the world, we just have to do what they say and be nice to their friends at BlackRock, Microsoft and the Chinese Communist Party. That means buying lots of windmills and solar panels because climate change is a human rights issue, but slave labor camps in Xingjiang are not. And who cares about child cobalt miners in the Congo? U.N. Rights Czar — ‘Truly Terrifying’ Famines, Floods, Fires, Ahead Unless ‘Climate Change’ AddressedSimon Kent Breitbart Volker Turk, the U.N. High Commissioner for Human Rights, declared Monday the planet is “[…] burning. It’s melting. It’s flooding. It’s depleting. It’s drying. It’s dying,” as he evoked a “dystopian future” for all unless “climate change” is addressed. The Austrian lawyer turned U.N. official said the time has come for everyone to heed the unelected body and address the long list of concerns it sees as threatening the very existence of the planet. Essentially, some lawyer appointed to a UN committee says extreme, preposterous, provably wrong things about climate science, global food, makes some end-of-world prophesies and some newspapers think it’s worth reporting.
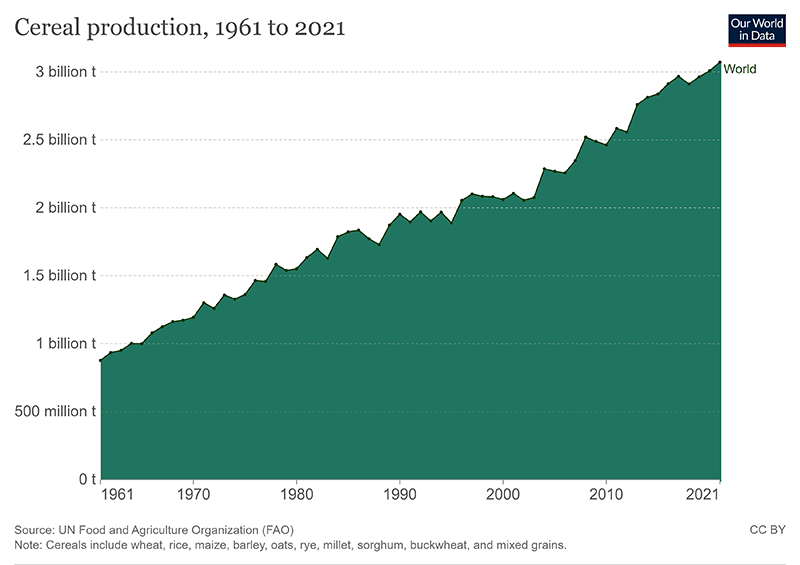
Turk told a UN Human Rights Council debate on the right to food that extreme weather events were wiping out crops, herds and ecosystems, making it impossible for communities to rebuild and support themselves. “More than 828 million people faced hunger in 2021. And climate change is projected to place up to 80 million more people at risk of hunger by the middle of this century,” said Turk. This is the catastrophe that climate change inflicts on global agriculture. Far from being wiped out, there has never been more food on Earth. The dystopia he warns about is here, but it’s where career bureaucrats can work 30 years at the UN, and get taken seriously when they are 100% wrong. The UN is the dystopia Orwell warned us about. Time to end it and give us our money back. REFERENCEHannah Ritchie, Pablo Rosado and Max Roser (2023) – “Agricultural Production“. Published online at OurWorldInData.org. Earth image by Bela Geletneky Wizard Artwork: pendleburyannette
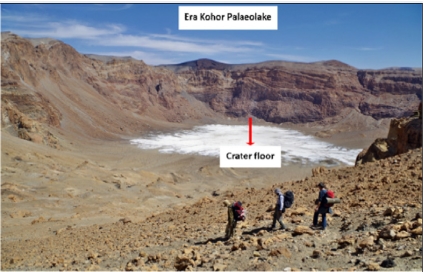
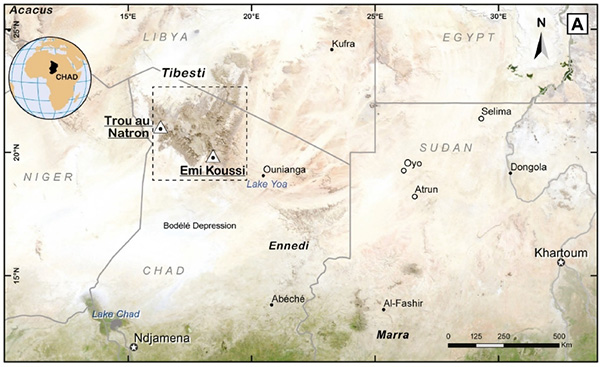
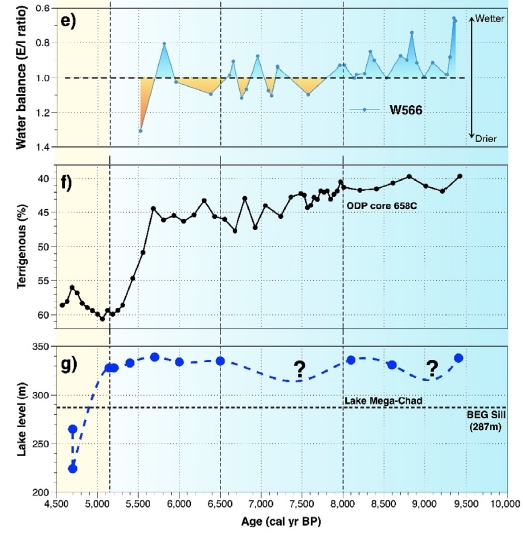
By Jo Nova Perhaps Africa could use some global warming?Thanks and credit to Kenneth Richard at NoTricksZone: New Study Finds The Early-Mid Holocene Sahara Had Lakes With Depths Of ‘At Least 300 Meters’During the hottest part of the Holocene, for thousands of years, there were deep lakes filled with water in the middle of the Sahara Desert. From 9,500 years ago to 6,000 years ago the monsoons rained on the Sahara, freshwater plankton frolicked in the lakes, and greenery grew far and wide. The wetter conditions made it possible for “widespread human occupation and the development of agriculture across North Africa”. Amazingly, that last quote comes from Kuper and Kropelin fully seventeen years ago. Strangely the UN experts don’t mention very often that in the warmer world not that long ago, the hyperarid Sahara desert was rich, green and filled with water? We wouldn’t want people to start wondering if climate change might mean Chad and Libya could be nicer places for Africans to live? Instead we’re told that global warming will turn into our whole world into the Saharan desert, only to find out that in a warmer world even the Sahara didn’t turn into the Saharan Desert. There once was a lake here… The new study by Yacoub et al shows how the water came and went in more detail, in the Tibesti Volcanic Massif (TVM) of northern Chad, but they cite twenty years of other studies that show a lost rich Saharan wilderness. The period is quietly known in academic circles as the African Humid Period (AHP). So yet again we find that the climate on Earth has always changed, that lakes, forests, and rainfall came and went without any input from coal fired plants or SUV’s and that solar panels probably would not have saved the once great green Sahara from turning into a hyperarid desert. We claim to have expert climate models, but we don’t really know why these big shifts happen, or how fast they occurred or what caused them — they are vaguely “linked” to the changes in sunshine that happen due to our orbit. But if we are still debating whether it ended quickly or gradually, then obviously we haven’t got a good grip on the driving forces. 7,020 years ago freshwater plankton lived and died leaving behind their silica skeltons. Things started to dry out about 5,500 years ago. The introduction to Yacoub et al is eye-opening. It is a literature review of scores of papers showing just how wet and green the Sahara was, and then wasn’t — in the blink of a geologic eye. There is still debate about how fast the green era disappeared. An extensive array of palaeoclimatic records (Shanahan et al., 2015; Holmes and Hoelzmann, 2017) and archaeological investigations (Cremaschi et al., 2014; Manning and Timpson, 2014) have shown that during this humid period, large parts of the present-day hyperarid Sahara and the semi-arid Sahel regions were much wetter and “greener” than today, and thus characterized by grasslands with tropical trees (Hély and Lézine, 2014), hosting numerous lakes (Hoelzmann et al., 2004; Drake et al., 2011) and incised by vast fluvial networks (Skonieczny et al., 2015). This early-to-mid Holocene period of greening of the Sahara, named the Green Sahara period (Claussen et al., 2017), was linked to the low precession in Earth’s orbit associated with high boreal summer insolation that induced the northward extension of the Intertropical Convergence Zone (ITCZ) and the intensification of the associated African monsoonal rainfall belt (Kutzbach and Liu, 1997; deMenocal, 2015; Dallmeyer et al., 2020). These wetter conditions enabled widespread human occupation and the development of agriculture across North Africa (Kuper and Kröpelin, 2006; Manning and Timpson, 2014). After the mid-Holocene, the southward retreat of the monsoonal rainfall belt led to drier conditions that provoked the desiccation of most lakes (Gasse, 2000) and critical demographic shifts (Manning and Timpson, 2014), sealing the end of the AHHP. Throughout the African continent, the timing and magnitude of the termination of the AHHP were probably variable in space and time (Shanahan et al., 2015) and there is a long-standing and on-going debate about whether the end of the AHHP and the subsequent drying of the Sahara was abrupt or gradual (deMenocal et al., 2000; Holmes, 2008; Kröpelin et al., 2008; Bard, 2013; Collins et al., 2017; Ménot et al., 2020; Chase et al., 2022). REFERENCESYacoub et al., (2023), The African Holocene Humid Period in the Tibesti mountains (central Sahara, Chad): Climate reconstruction inferred from fossil diatoms and their oxygen isotope composition Kuper and Kropelin, (2006): Climate-controlled holocene occupation in the Sahara: motor of africa’s evolution. Science 313, 803e807. https://doi.org/10.1126/ science.1130989
… By Jo Nova Thirteen remarkable minutes everyone needs to see. Remarkably, despite the aura of modern space-age medicine — not one childhood vaccine of the 72 that are recommended in the US — has ever been subject to a long term pre-licensing placebo controlled safety trial. Kennedy knows, because he took legal action to get Anthony Fauci to supply one study. After a year of litigation, they admitted they could not provide a single study. As Kennedy says, he’s not anti-vaccination, he just wants good safety studies — something everyone wants, except maybe certain shareholders. “Calling people “anti-vaxxers” is a way of silencing them.” So, for decades, our highly trained doctors have been injecting babies and children with medicines that we didn’t test properly. The four big companies that make vaccines … Merck, Sanofi, Glaxo and Pfizer, have paid over $35 billion dollars in criminal penalties in the last decade, for lying to doctors, falsifying science, for defrauding regulators… RF Kennedy Junior’s site is Children’s Health Defense. They have a list of safety studies and controlled trials that use active ingredients in the comparison arm instead of inert placebos like sugar pills. Putting active compounds in both arms of the trial is more likely to produce similar side effects in both sides of the trial, effectively disguising any effect those ingredients have. Kennedy is such an old hand at the vaccine debate, watch how deftly he uses Elizabeth Vargas’s poorly thought out questions to turn the tables. He’s quite the lawyer, getting her to clarify what she means, fencing her into admitting that no one is suggesting vaccines never cause any harm. At one point she is just gob-smacked, struck dumb. She has not done her research, she just assumed he was the loopy-kooky guy she thinks all “anti-vaxxers” are. (See how name-calling works?) Her spontaneous interruptions, her absolute declaration of faith in the studies that don’t exist, is the perfect foil for RFK. When Vargus resorts to reciting attacks from his own family, he doesn’t even mention them, just asks her if her family agrees with everything she says. All the medical organizations and doctors trust and rely on the FDA and the CDC. But these are the same agencies that get more funding from Big Pharma than they do from the taxpayer. In 1969, one former FDA commissioner himself warned us that the FDA protects the drug companies, not the people, and yet here we are 54 years later, and most people have no idea. Perhaps the $15 billion a year Big Pharma spends on seemingly pointless media advertising has a point? It’s a forcefield against bad news… h/t John Connor II, Kevin a. Image by Peter Lomas from Pixabay
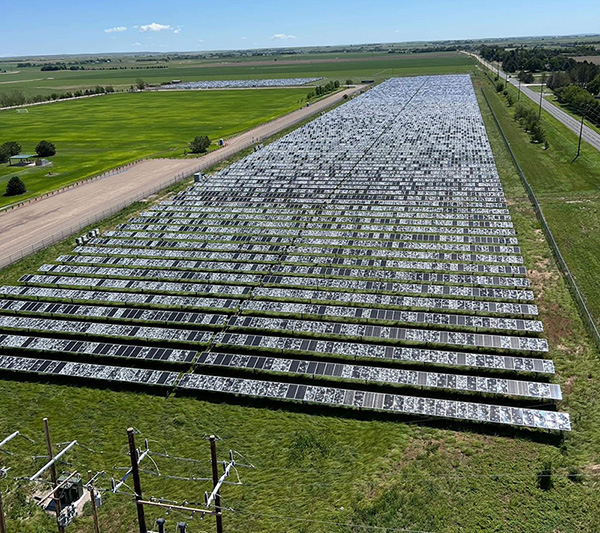
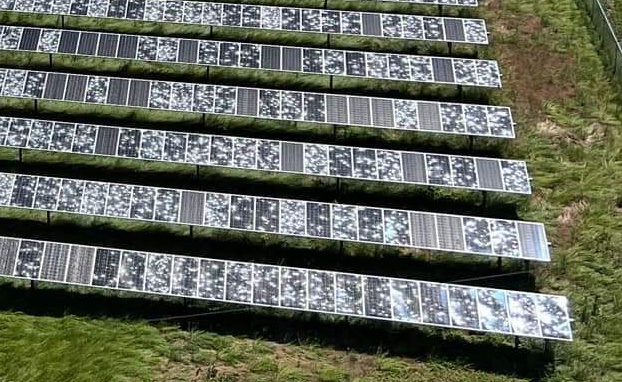
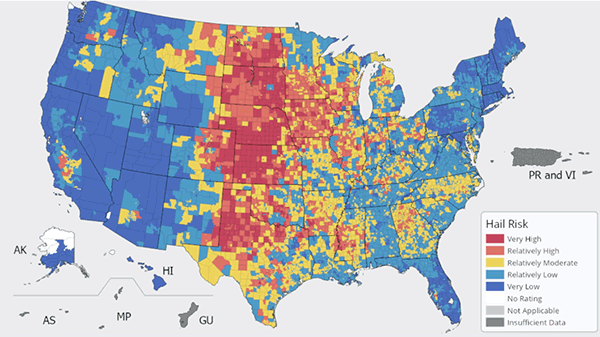
By Jo Nova Hail destroyed most of the three year old Scottsbluff community solar project in Nebraska this week. Solar energy might be free but collecting it requires vast acreages of fragile and expensive infrastructure. Imagine if a three year old coal plant was “destroyed by hail?” Scottscliffe was a 5.2MW plant with 14,000 panels that started operating in the Spring of 2020. In theory it was going to reduce the “carbon footprint and stabilize city costs for the next 25 years”. Instead it will increase the toxic metal in landfill. There were tornadoes in the area at the time, but there doesn’t appear to be damage to the fences, trees or poles surrounding the plant. About a quarter of the panels may have survived, or at least don’t have damage visible from 100 meters away… We hope they had insurance. Baseball-sized hail took out a 5.2-megawatt solar farm in Scottsbluff, Nebraska, on FridayKevin Killough, Cowboy State Daily [Don Day, Cowboy State Daily meteorologist] said that the region around southeast Wyoming has some of the highest frequencies of hailstorms in the country. “It’s ground zero,” Day said. The average is seven to nine hailstorms per year. That includes everything from pea-sized to baseball-sized hail. “Scottsbluff last Friday night was just absolutely pummeled,” Day said. Day said that the storms are covering a sparsely populated area with little development, so they don’t always cause a lot of damage. As more solar farms are built, he said there will likely be more shattered panels. Sometimes the places with the most sun also have the most hailstones… Thanks to Bill in AZ for the tip, and Matt Larsen for the photo.
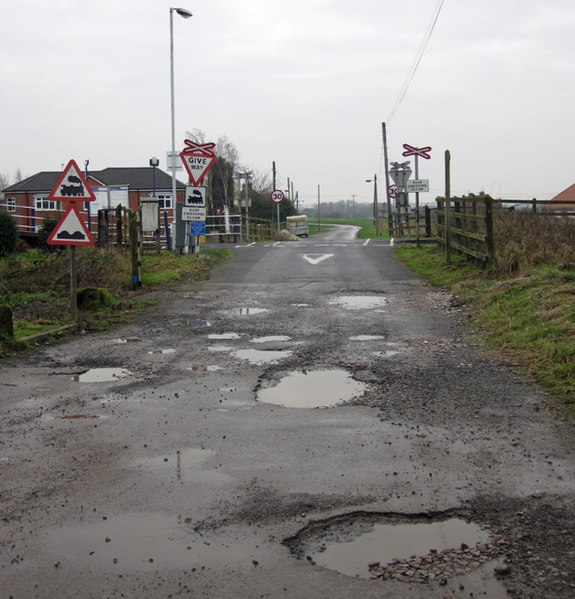
Wrecking the roads to save the nation from 0.01 degree C?Electric cars may cause twice as much damage to roads as normal petrol driven cars. EV’s are heavier, and heavier cars may break bridges and car parks, they wear out tyres 50% faster, increasing pollution, they will cause more road deaths (of other people in smaller cars), and now, they probably wear out roads faster too. Did anyone think about the carbon emissions of new asphalt and new road surfaces? Major roads are built to take heavier trucks, but suburban streets were only designed to cope with the occasional truck — not the truck that lives next door. When every car has 300 kilograms more “luggage” there will be consequences. And remember underlying all this, no one even knows if EV’s will reduce carbon dioxide. An e-Golf has to be driven 100,000 kilometers just to break even with a diesel equivalent. With all these extra lifetime costs, if carbon dioxide mattered at all, EV’s might end up raising global temperatures. But who cares about that eh? It’s not about carbon, and it’s not about the environment. It’s about control. Thanks to TallblokePothole damage from electric cars is double that of petrol, Telegraph data showJack Simpson, The Telegraph The country is suffering from a pothole crisis, with half as many filled last year compared to a decade ago amid an estimated £12 billion price tag to fill them all. The Telegraph found that the average electric car puts 2.24 times more stress on roads than its petrol equivalent, and 1.95 more than diesel. Larger electric vehicles weighing over 2,000kg (2 tons) cause the most damage, with 2.32 times more wear applied to roads. The AA reported last month that the number of pothole-related call-outs it had received had grown by a third in a year, with the company responding to 52,000 incidents in April alone. A little bit of weight creates bigger better holes in the road: Fourth power formulaThe analysis uses the “fourth power formula”, which is widely used by highways engineers and researchers to assess the damage caused to road surfaces by heavier vehicles. It means that if weight on a vehicle’s axle is doubled, it does 16 times the damage to the road. Cut the subsidies, recover fair costs, and the free market will sort this one out. Potholes photo: David Wright Creative Commons 2.0
Oops. Yes. Where did Tuesday go?
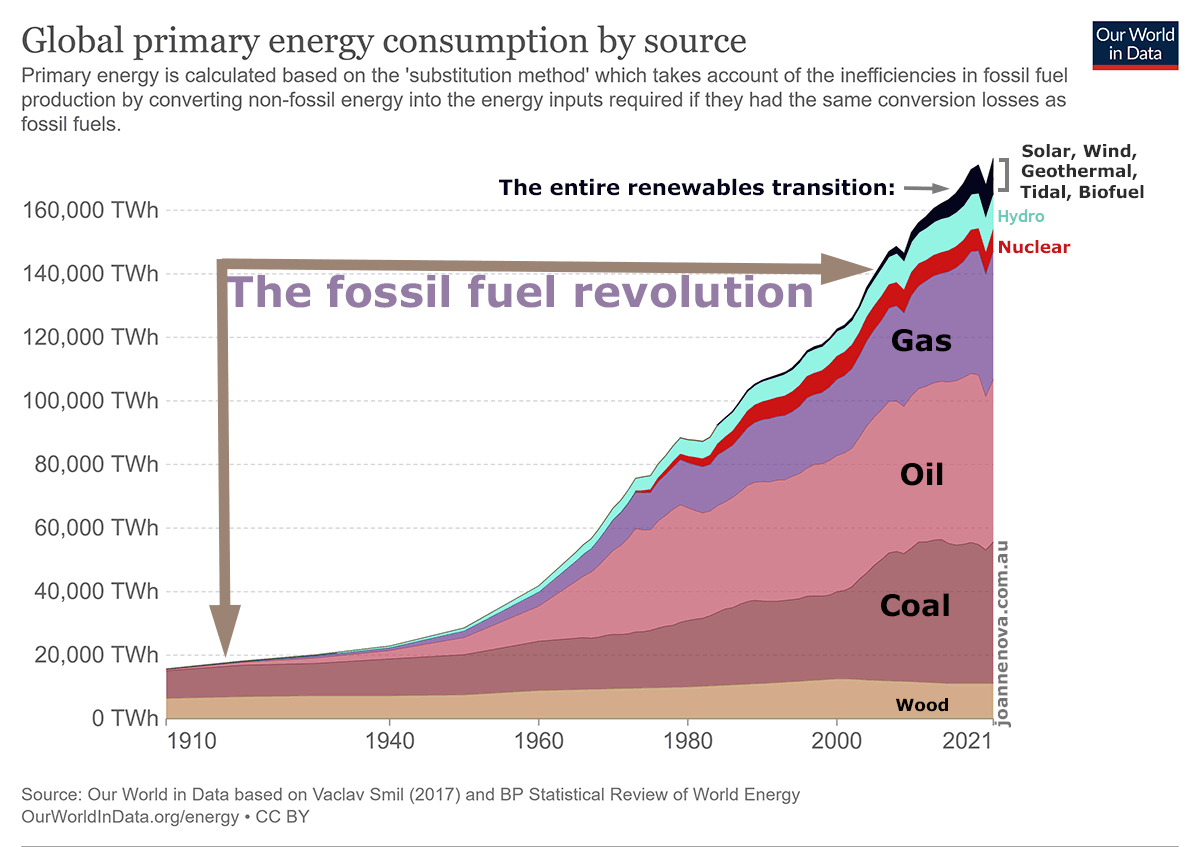
 Image by David Mark from Pixabay We are a fossil fueled world. Solar & wind power make up just
|
||||
|
Copyright © 2025 JoNova - All Rights Reserved |
||||











Recent Comments